|
|
| Copyright © Klaus Piontzik | ||
| German Version |
| The individual parts of the Fourier analysis allow a graphical representation of the total situation.
All extreme values, magnetic structures and source points that result from the Fourier analysis are entered into the total intensity map, as can be seen in Figure 4.6.1. |
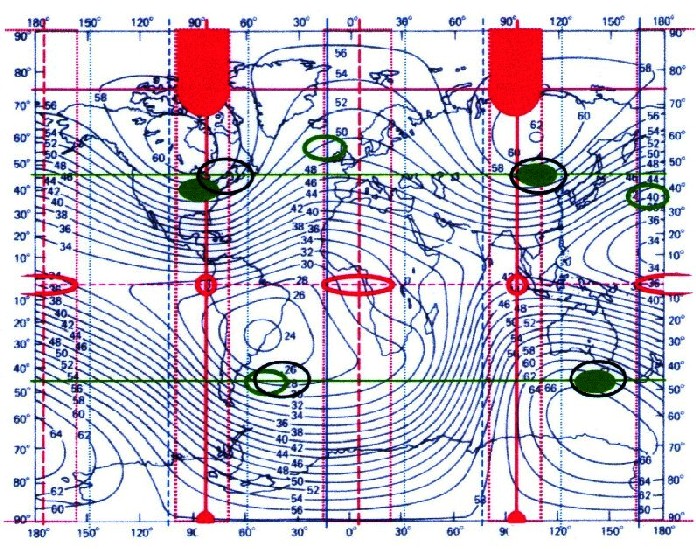
| Illustration 4.6.1 - earth magnetic field |
| It applies to the color assignment in Figure 4.6.1: Blau – three-axle ellipsoid Rot – Zonal, Sectorial (Grid ZS) Grün – Tesseral Schwarz - Hyugens source points Figure 4.6.1 shows connections that are presented in detail on the next pages. These are the relationships between the earth's magnetic field and the shape of the earth, the effects of the grid ZS on the magnetic conditions in the Arctic, as well as the position of the tesseral field and the position of the Huygen source points. |
| With the help of satellite geodesy by C.A. Lundquist and G. Veis in 1966 the following parameters have been identified to represent the earth as a genuine three-axle ellipsoid: |
| a1
– a2
= 69 Meter λ0 = – 14.75 degrees West |
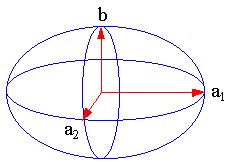
| Illustration 4.6.1.1 - Three-axle ellipsoid |
| The blue
ellipsoid grid in illustration 4.6.1 is based on the values of Lundquist and Veis and is moved to the red magnetic system about 1.25 degrees
verschoben. So seen globally, a good match exists An analysis of the geographic locations of all occurring magnetic extremes results in a functional relationship for their longitude. The derivation of the following equation can be found in the book "Grid Structures of the Earth's Magnetic Field", Chapter 4.4, The Zero Point, pages 39-41 and Chapter 9.5, The Grid ZS, pages 70-71. See also "Grid Structures of the Earth's Magnetic Field", Chapter 17, The Shape of the Earth, pages 146-158. |
| 4.6.1.1 - Equation: | m is an element of the integers (...-2,-1,0,1,2,...) |
| 4.6.1.2 - Theorem: | The earth magnetic field stand in relation to the figure of the earth |
| The red
magnetic system in the illustration 4.6.1 represents
the Grid ZS, so the zonal-sectoral part.
In equation 4.5.2.1, the term 11.3642 cos 2φ appears in the zonal part. This corresponds to the dipole portion of the earth's field. The dipole portion accounts for approximately 84% of the total field. Since the sectoral components are added here, a magnetic ridge is created at the north pole, while at the south pole there is only a point-shaped maximum zone. |
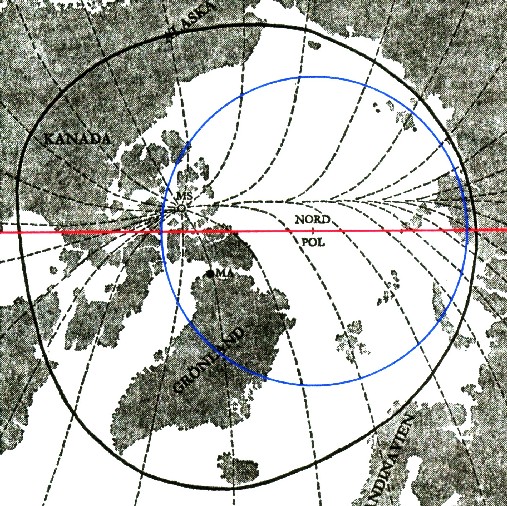 |
The figure shows the northern lights zone (black circle) and the geomagnetic conditions in the Arctic. The zonal (blue circle) and the sectorial (red line) maximum zone are shown. The magnetic ridge in the Arctic can be explained by adding the zonal and the sectoral parts. | |
| Illustration 4.6.2.1 - Magnetic Conditions in the Arctic |
|
The magnetic ridge represents the maximum zone of the basic field ZS.
The zonal maximum zone extends from the pole to about 67° north latitude. T
his corresponds well with the aurora zone.
The magnetic field in the Arctic Circle is mainly characterized by the basic field ZS. The maximum zone = main magnetic meridian (thick red) , in Figure 4.6.1, can be clearly seen at Lambda = - 83.5° West and Lambda = 96.5° East. The minimum zones (dashed red) are at Lambda = 5.25° East and at Lambda = - 174.25° West. The global conditions of the grid ZS are shown again in Figure 4.6.2.2. The blue vertical lines represent the principal axes for a three-axis ellipsoid. |
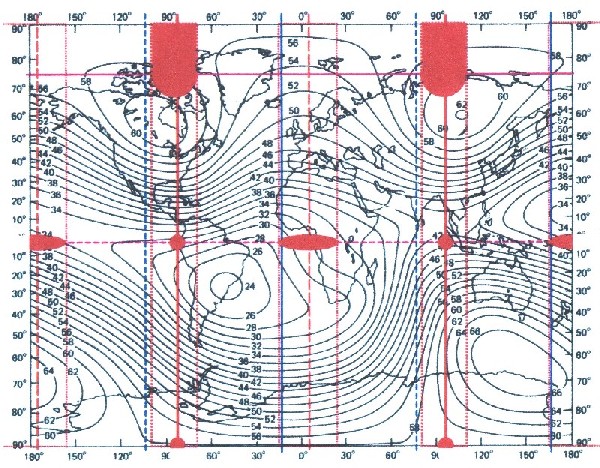
Illustration 4.6.2.2 - basic field ZS
| In the equatorial plane there are two minimum zones (red ellipses)) and two saddle points (red circles), each 90 degrees apart.
See also "Grid Structures of the Earth's Magnetic Field", Chapters 9.2-9.7, pages 64-72. |
| 4.6.2.1 - Theorem: | All extreme value zones of the grid ZS lie on the corners of an octahedron. |
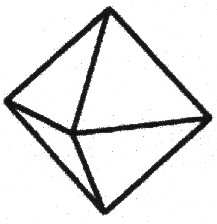
| Illustration 4.6.2.3 – octahedron |
| See also "Grid structures of the earth's magnetic field", chapters 9.2-9.7, pages 64-72. |
| The ggreen system, in Figure 4.6.1, represents the tesseral portion.
All extreme values are approximately ±45° latitude.
The green points represent the maximum and minimum points of the pure (tesseral) grid portion of the earth's magnetic field. The global conditions of the tesseral field are shown again in Illustration 4.6.3.1. Full green = Maximum Green border = Minimum |
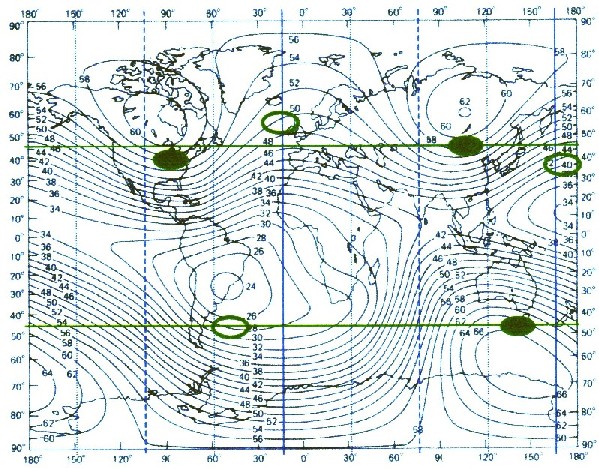
Illustration 4.6.3.1 - Tesseral extrema
| The blue vertical lines represent the principal axes for a three-axis ellipsoid.
In the northern hemisphere, all extreme values ??lie approximately on a square. The extremal zones, in the southern hemisphere, are shifted by around 35-40° 35-40° compared to the northern extremal zones.. The 45° width creates a twisted Late (cube) in the earth in terms of coordinates. |
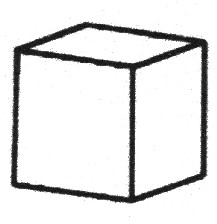
| Illustration 4.6.3.2 – Cube |
| 4.6.3.1 - Theorem: | The extreme value zones of the tesseral field lie on the corners of a twisted cube. (Late) |
| See also "Grid structures of the earth's magnetic field", chapter 9.8, The tesseral part, pages 73-75. The tesseral portion is almost identical to the non-dipole field, which makes up about 16% of the Earth's total magnetic field. As with the grid ZS, the length position equation 4.6.1.1 also applies to the tesseral part for the extremal values. |
| The black-bordered
ellipses in Figure 4.6.1 represent the Huygen source points of the entire field.
Assuming the basic field or grid model and Huygen's principle, these four poles represent the theoretical source points from which the entire external magnetic field on the earth's surface can be spanned. The source points lie on the corners of a tetrahedron. In contrast, the sources in the southern hemisphere are shifted by 45°. |
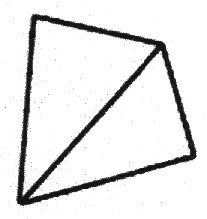
| Illustration 4.6.4.1 – tetrahedron |
| 4.6.4.1 - Theorem: | The Huygen source points lie on the corners of a twisted tetrahedron. |
| There is agreement between the source areas and the four main extrema of the tesseral field.
See also "Grid structures of the earth's magnetic field", chapter 11.7, Determining the source points, page 91. The global relationships of the Huygen source points are shown again in Illustration 4.6.4.2. The solid red vertical, lines represent the main magnetic meridian. |
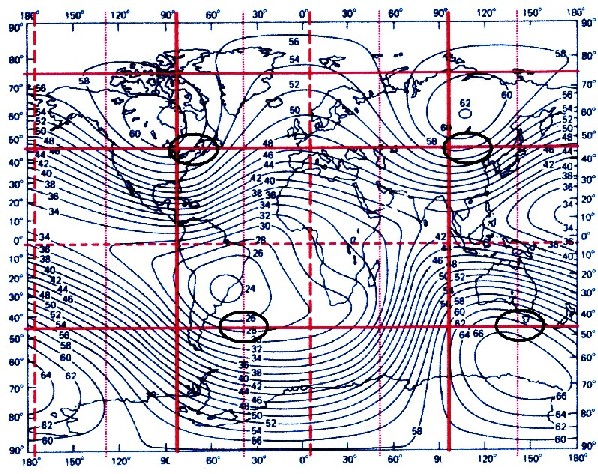
Illustration 4.6.4.2 – Huygen source points
| According to the numerical Fourier analysis,
the static part of the earth's field in Equation 2.5.2.1 is 47,2183 uT.
The minimum value of the field is 24 uT, the maximum value is 62 uT. This explains that around 75% of the field behaves like a permanent magnet, i.e. only 25% of the field forms the magnetic oscillation structure. All extreme value zones of the lattice ZS lie on the corners of an octahedron. The extreme value zones of the tesseral field lie on the corners of a twisted cube or a spat. The Huygen source points of the field lie on the corners of a twisted tetrahedron. The magnetic extrema are arranged in the form of the simpler Platonic solids (tetrahedron, cube, octahedron). Remark: A parallelepiped (synonyms: spat, parallelepiped, parallelotope) is a geometric body bounded by six parallelograms. The name spat comes from calcite, whose crystals have the shape of a paralelepiped. The earth's magnetic field is related to the shape of the earth. The ellipsoidal grid is shifted from the magnetic system by only 1.25 degrees. An analysis of all occurring magnetic extrema results in a functional connection, for their geographical longitude: |
| 3,75 degrees <=> 96 pitch |
| The 96 division provides sufficient differentiation to contain all angles that occur for polyhedra or Platonic solids. |
| 4.6.5.1 - Theorem: | All Platonic solids are possible as vibration figures of the earth's vibration structure. |
|
200 sides, 23 of them in color 154 pictures 38 tables Production und Publishing: ISBN 978-3-7357-3854-7 Price: 25 Euro |
![]()